In vivo hematopoiesis (DARLIN data)
Hematopoiesis dataset from Li, L., ..., S.-.W. Wang, F. Camargo, Cell 186, (2023).
The DARLIN lineage tracing mouse was induced with Dox for lineage barcoding at E17. This dataset contains cells collected at multiple tissues (left leg, spleen, and skull) 10 weeks after induction. We will focus on the analysis of the skull-derived cells as most blood cell types were well-represented in this dataset and study the fate bias of HSPCs in this dataset.
There is only one time point. We manually assign the early progenitor (HSPC) as the initial population with time t0, and the remaining cells as the later population with time t1. This is needed for running cospar.
[27]:
import cospar as cs
import scanpy as sc
import pandas as pd
import scipy.sparse as ssp
import seaborn as sns
from matplotlib import pyplot as plt
import numpy as np
import os

## setting cospar
cs.logging.print_version()
cs.settings.verbosity=0

%matplotlib inline
%config InlineBackend.figure_format = 'svg' #'retina'


## plot settings
from matplotlib import cbook, cm, colors, rcParams
cs.settings.set_figure_params(format='pdf',figsize=[4,3.5],dpi=100,fontsize=15,pointsize=2,dpi_save=300)
rcParams["axes.grid"] = False
cmap_reds=cs.pl.darken_cmap(plt.cm.Reds,scale_factor=0.9)
def find_vmax(values):
    return np.percentile(values,q=99)

figure_path=cs.settings.figure_path
#pd.options.display.max_rows = 200
Running cospar 0.3.3 (python 3.8.16) on 2023-11-22 13:50.
ERROR: XMLRPC request failed [code: -32500]
RuntimeError: PyPI no longer supports 'pip search' (or XML-RPC search). Please use https://pypi.org/search (via a browser) instead. See https://warehouse.pypa.io/api-reference/xml-rpc.html#deprecated-methods for more information.
Load adata with both RNA and lineage
If the following downloading method is not working, try using this link https://westlakeu-my.sharepoint.com/:u:/g/personal/wangshouwen_westlake_edu_cn/ETiN1opaD-lFsmUOelCqXcEBU3tGJNNtdnYCREtMDqUqfA?e=BzHhr3
Once the adata has been downloaded manually, the following code to load the data
cs.hf.read(‘path/to/tissue_adata_refined_20221106_joint.h5ad’)
[ ]:
adata_orig=cs.datasets.DARLIN_in_vivo_hematopoiesis()
[3]:
# Only keep cells from skull and remove Dc (as there are few Dc)
adata_orig=adata_orig[adata_orig.obs['tissue'].isin(['Skull'])]
adata_orig=adata_orig[adata_orig.obs['state_info']!='Dc']
adata_orig.uns['data_des']=['Skull']

adata_orig.obs['cell_type']=adata_orig.obs['cell_type'].astype(str)
adata_orig.obs['cell_type']=pd.Categorical(adata_orig.obs['cell_type']).set_categories(['HSC', 'MkP','Ery', 'Baso', 'Neu', 'Mon', 'LMPP'], ordered=True)
adata_orig.uns['cell_type_colors']=['#d62728','#ff7f0e', '#1f77b4', '#279e68',  '#aa40fc', '#8c564b', '#e377c2'] #,'#d9d9d9']
adata_orig.obs['state_info']=adata_orig.obs['cell_type'].astype(str)
/Users/shouwen/opt/miniconda3/envs/CoSpar_test/lib/python3.8/site-packages/anndata/compat/_overloaded_dict.py:106: ImplicitModificationWarning: Trying to modify attribute `._uns` of view, initializing view as actual.
  self.data[key] = value
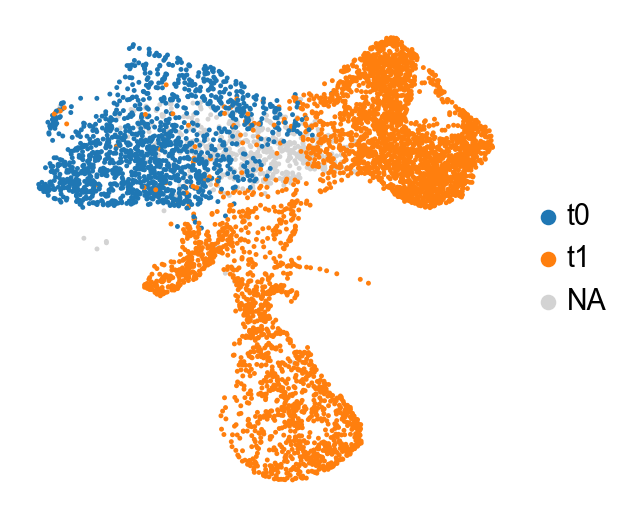
Manually annotate the time info
HSPCs are annotated as the initial population (t0), and the mature population are annotated as the later population (t1)
[4]:
time_map={'LMPP':'t0', 'HSC':'t0', 'NA':'t1','Baso':'t1', 'MkP':'t1', 'Mon':'t1',  'Ery':'t1','Neu':'t1', 'Dc':'t1'}
adata_orig.obs['time_info']=adata_orig.obs['cell_type'].map(time_map)
cs.pp.initialize_adata_object(adata_orig)
[4]:
AnnData object with n_obs × n_vars = 6094 × 21406
    obs: 'library', 'batch', 'n_genes', 'n_counts', 'n_genes_by_counts', 'total_counts', 'total_counts_mt', 'pct_counts_mt', 'doublet_score', 'predicted_doublet', 'cell_type', 'state_info', 'time_info', 'tissue', 'state_info_old'
    var: 'n_cells', 'mt', 'n_cells_by_counts', 'mean_counts', 'pct_dropout_by_counts', 'total_counts', 'highly_variable'
    uns: 'cell_type_colors', 'clonal_time_points', 'clone_id', 'data_des', 'library_colors', 'neighbors', 'scrublet', 'time_ordering', 'tissue_colors', 'umap'
    obsm: 'X_clone', 'X_emb', 'X_pca', 'X_umap'
    obsp: 'connectivities', 'distances'
Transcriptomic analysis
[5]:
cs.pp.refine_state_info_by_leiden_clustering(adata_orig,selected_key='state_info',selected_values='HSC')
OMP: Info #276: omp_set_nested routine deprecated, please use omp_set_max_active_levels instead.
[6]:
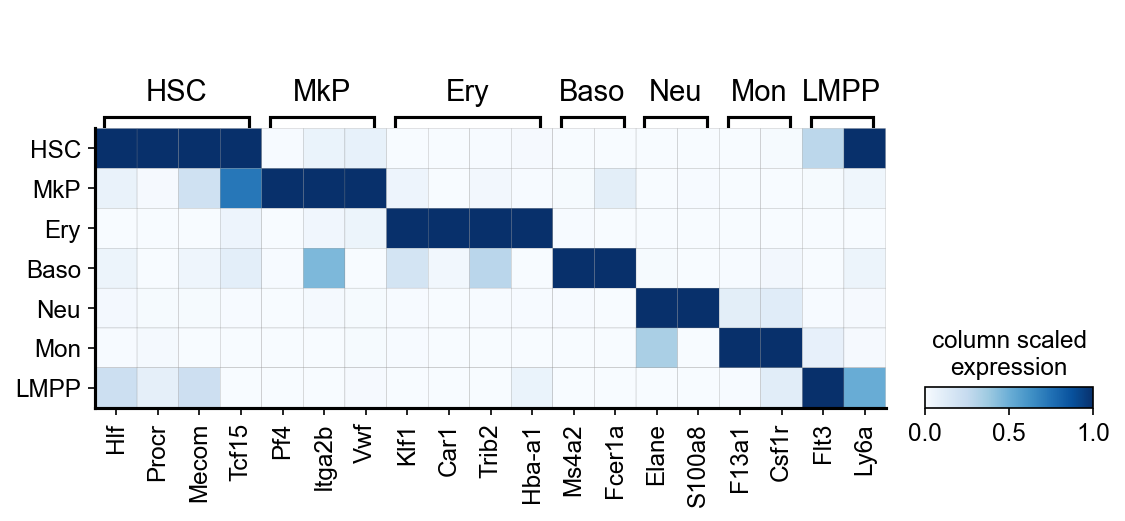
# markers per cell type:
celltype_genes={
'HSC' : ['Hlf', 'Procr','Mecom','Tcf15'],
'MkP' : ['Pf4', 'Itga2b', 'Vwf'],
'Ery' : ['Klf1', 'Car1','Trib2','Hba-a1' ],
'Baso' : ['Ms4a2', 'Fcer1a'],
'Neu' : [ 'Elane', 'S100a8'],
'Mon' :  ['F13a1', 'Csf1r'],
'LMPP' : ['Flt3','Ly6a']} #'Dntt','Cd79a','Cd19'

sc.settings.set_figure_params(dpi=75)#, facecolor='white')
sc.pl.matrixplot(adata_orig, celltype_genes,
                 'cell_type', dendrogram=False, cmap='Blues', standard_scale='var',
                 colorbar_title='column scaled\nexpression',save='matriplot_marker_genes')
WARNING: saving figure to file figures/matrixplot_matriplot_marker_genes.pdf

[7]:
make_gene_heatmap=False
if make_gene_heatmap:
    sc.tl.rank_genes_groups(adata_orig, 'cell_type', method='wilcoxon')
    sc.pl.rank_genes_groups(adata_orig, n_genes=10, sharey=False)

    adata_orig_sub=adata_orig[~pd.isna(adata_orig.obs['cell_type'])]
    sc.tl.filter_rank_genes_groups(adata_orig_sub)
    sc.pl.rank_genes_groups_heatmap(adata_orig_sub, n_genes=200, key='rank_genes_groups_filtered',
                                    swap_axes=True, use_raw=False, vmax=10, vmin=0, cmap='Reds', dendrogram=False,save='gene_heatmap')
[8]:
sc.settings.set_figure_params()
adata_orig.obs['selection']=np.nan
adata_orig.obs.loc[adata_orig.obs['time_info']=='t0','selection']='s'
sc.pl.embedding(adata_orig,color='selection',basis='X_umap',frameon=False,title='',palette={'s':'#636363'},
               save='_selection',size=50)
WARNING: saving figure to file figures/X_umap_selection.pdf

[9]:
cs.pl.embedding(adata_orig,color='Ly6a',frameon=False)

[10]:
adata_t0=adata_orig[adata_orig.obs['time_info']=='t0']
sc.pl.embedding(adata_t0,color='cell_type',basis='X_umap',legend_loc='on data',
           legend_fontsize=14, legend_fontoutline=1.5,s=100,frameon=False,title='',
               save='_t0_cell_type')
WARNING: saving figure to file figures/X_umap_t0_cell_type.pdf
[11]:
sc.pl.embedding(adata_orig,color='time_info',basis='X_umap',frameon=False,title='',
               save='_time_info')
WARNING: saving figure to file figures/X_umap_time_info.pdf
[12]:
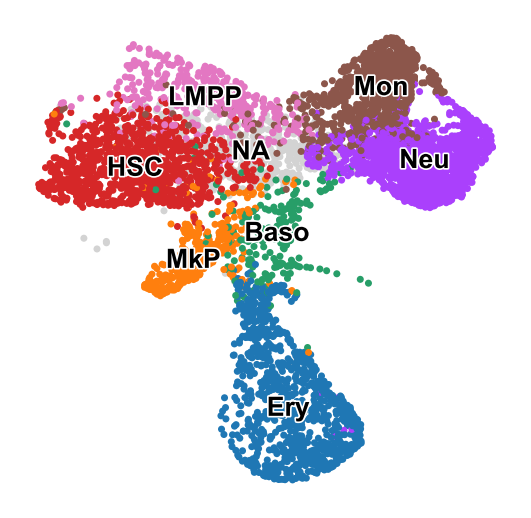
sc.pl.embedding(adata_orig,color='cell_type',basis='X_umap',frameon=False,title='',legend_loc='on data',
           legend_fontsize=12, legend_fontoutline=1.5,s=40,
               save='_skull_celltypes')
WARNING: saving figure to file figures/X_umap_skull_celltypes.pdf

Basic clone statistics
[13]:
df_clone=cs.tl.clone_statistics(adata_orig,joint_variable='state_info');
[14]:
cs.tl.add_clone_id_for_each_cell(adata_orig)
[15]:
np.sum((adata_orig.obsm['X_clone'].sum(0)>0).A.flatten())
[15]:
1034
[28]:
fig,ax=plt.subplots(figsize=(4,3.5))
sns.histplot(df_clone['clone_size'],log_scale=True,color='#8da0cb')
plt.yscale('log')
plt.title(f'{len(df_clone)} clones')
plt.tight_layout()
plt.savefig(f'{figure_path}/skull_clone_distribution.pdf')

[29]:
df_cell_N=pd.DataFrame(adata_orig.obs['cell_type']).reset_index().groupby('cell_type').agg(count=('index','count')).reset_index()
[30]:
rcParams["axes.grid"] = False
fig,ax=plt.subplots(figsize=(4,3))
plt.bar(df_cell_N['cell_type'],df_cell_N['count'],color='#8da0cb')
#ax=sns.barplot(data=df_clone,x='state',y='clone_N',color=dict(zip(df_clone['state'],df_clone['color']))) #['black', 'red', 'green', 'blue', 'cyan'])
plt.xticks(rotation=90)
plt.ylabel('Cell number')
plt.tight_layout()
plt.savefig(f'{figure_path}/Skull_clone_number_per_cluster.pdf')

[31]:
sns.histplot(df_clone['clone_size'],log_scale=True)
#plt.yscale('log')
[31]:
<AxesSubplot:xlabel='clone_size', ylabel='Count'>

Clone output
[32]:
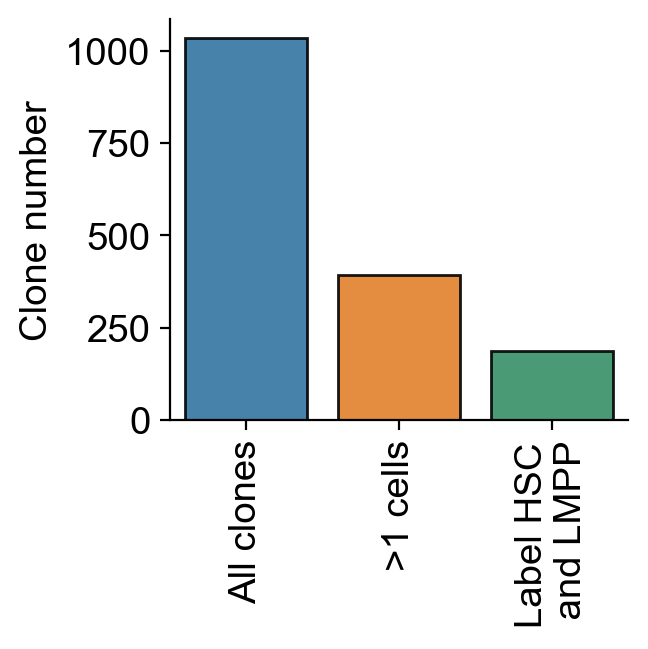
all_clones_N=np.sum(adata_orig.obsm['X_clone'].A.sum(0)>0)
All clones (regardless of clone size)
[33]:
rcParams["axes.grid"] = False
selected_fates=['HSC',  'LMPP','MkP','Ery','Mon',  'Neu', ]
cs.pl.barcode_heatmap(adata_orig,selected_fates=selected_fates,normalize=True)
plt.ylabel('Clone')
plt.title(f'{all_clones_N} clones')
plt.tight_layout()
plt.savefig(f'{figure_path}/all_clone_heatmap.pdf')

only select clones with at least 1 cells
[34]:
del adata_orig.uns['clone_id']
cs.tl.filter_clones(adata_orig, clone_size_threshold=2, filter_larger_clones=False)
clones_N_2cells=np.sum(adata_orig.obsm['X_clone'].A.sum(0)>0)
[35]:
selected_fates=['HSC',  'LMPP','MkP','Ery','Mon',  'Neu', ]
cs.pl.barcode_heatmap(adata_orig,selected_fates=selected_fates,normalize=True)
plt.ylabel('Clone')
plt.title(f'{clones_N_2cells} clones')
plt.tight_layout()
plt.savefig(f'{figure_path}/all_clone_heatmap_>1.pdf')

Select clones that label both HSC and LMPP
Select clones labeling only HSC
[36]:
restricted_X_clone_HSC=cs.tl.conditional_heatmap(adata_orig.uns['barcode_heatmap']['coarse_X_clone'],
                                          adata_orig.uns['barcode_heatmap']['fate_names'],
                                          included_fates=['HSC'],normalize=True,mode='or')
/Users/shouwen/Documents/packages/cospar/cospar/tool/_clone.py:869: FutureWarning: X.dtype being converted to np.float32 from float64. In the next version of anndata (0.9) conversion will not be automatic. Pass dtype explicitly to avoid this warning. Pass `AnnData(X, dtype=X.dtype, ...)` to get the future behavour.
  adata_orig = sc.AnnData(X_clone)

Select clones labeling only LMPP
[37]:
plt.rcParams["figure.figsize"]=(4,4)
restricted_X_clone_LMPP=cs.tl.conditional_heatmap(adata_orig.uns['barcode_heatmap']['coarse_X_clone'],
                                          adata_orig.uns['barcode_heatmap']['fate_names'],
                                          included_fates=['LMPP'],excluded_fates=['HSC'],normalize=True,mode='and')
/Users/shouwen/Documents/packages/cospar/cospar/tool/_clone.py:869: FutureWarning: X.dtype being converted to np.float32 from float64. In the next version of anndata (0.9) conversion will not be automatic. Pass dtype explicitly to avoid this warning. Pass `AnnData(X, dtype=X.dtype, ...)` to get the future behavour.
  adata_orig = sc.AnnData(X_clone)

Order these clones
[38]:
restricted_X_clone_HSC_new=cs.pl.custom_hierachical_ordering(
        np.arange(restricted_X_clone_HSC.shape[0]), restricted_X_clone_HSC
    )

restricted_X_clone_LMPP_new=cs.pl.custom_hierachical_ordering(
        np.arange(restricted_X_clone_LMPP.shape[0]), restricted_X_clone_LMPP
    )
[39]:
tot_clone_N_HSC_LMPP=np.hstack([restricted_X_clone_HSC_new,restricted_X_clone_LMPP_new]).T.shape[0]
print(tot_clone_N_HSC_LMPP,'clones')
187 clones
concatenate these clones
[40]:
cs.pl.heatmap(np.hstack([restricted_X_clone_HSC_new,restricted_X_clone_LMPP_new]).T,order_map_x=False,order_map_y=False,
             x_ticks=adata_orig.uns['barcode_heatmap']['fate_names'],color_bar_label='Intra-clone fraction')
plt.ylabel('Clone')
plt.title(f'{tot_clone_N_HSC_LMPP} clones that have >1 cells\nand label HSPCs')
plt.tight_layout()
plt.savefig(f'{figure_path}/Skull_HSC_output.pdf')
[41]:
fig,ax=plt.subplots(figsize=(3.5,3.5))
kwargs = {'alpha':0.9, 'linewidth':1, 'edgecolor':'k'}
ax=sns.barplot(x=[1,2,3],y=[all_clones_N,clones_N_2cells,tot_clone_N_HSC_LMPP],**kwargs)
ax.set_xticks([0,1,2], ['All clones','>1 cells','Label HSC\n and LMPP'], #['All clones', 'Clones with \n >1 cells', 'Clones with \n HSPCs \n and >1 cells'],
       rotation=90)  # Set text labels and properties.
ax.set_ylabel('Clone number')
plt.tight_layout()
plt.savefig(f'{figure_path}/clone_number_breakdown.pdf')

[42]:
X0=np.hstack([restricted_X_clone_HSC_new,restricted_X_clone_LMPP_new]).T[:,2:]
X1=X0[X0.sum(1)>0] # only select clones with both state and fate outcomes
frac=np.sum((X1/(X1.sum(1)[:,np.newaxis]+10**(-10)))>0.99,axis=1).mean()
print(f'{100*frac:.2f}% of {len(X1)} clones ({X1[0]}) labling early progenitor have a single fate outcome')
48.57% of 140 clones ([0.09811269 0.28963016 0.16509398 0.10756418]) labling early progenitor have a single fate outcome
Clonal coupling between cell types and their p-values
[43]:
adata_output,X_coupling_random=cs.tl.pvalue_for_fate_coupling(adata_orig,selected_fates=selected_fates,max_N_simutation=10000,normalize=True)
/Users/shouwen/Documents/packages/cospar/cospar/tool/_map.py:371: ImplicitModificationWarning: Trying to modify attribute `.obs` of view, initializing view as actual.
  adata.obs["time_info"] = pd.Categorical(adata.obs["time_info"].astype(str))
/Users/shouwen/opt/miniconda3/envs/CoSpar_test/lib/python3.8/site-packages/anndata/compat/_overloaded_dict.py:106: ImplicitModificationWarning: Trying to modify attribute `._uns` of view, initializing view as actual.
  self.data[key] = value
100%|█████████████████████████████████████| 10000/10000 [02:07<00:00, 78.72it/s]
[44]:
sns.histplot(X_coupling_random[:,0,2])
[44]:
<AxesSubplot:ylabel='Count'>

[45]:
X_coupling=adata_output.uns['fate_coupling_X_clone']['X_coupling']
fate_names=adata_output.uns['fate_coupling_X_clone']['fate_names']
pvalue=adata_output.uns['fate_coupling_X_clone']['pvalue']
pvalue_greater=adata_output.uns['fate_coupling_X_clone']['pvalue_greater']
pvalue_less=adata_output.uns['fate_coupling_X_clone']['pvalue_less']
The coupling matrix has been computed, and can be visualized directly
[46]:
cs.pl.fate_coupling(adata_output, source="X_clone",vmax=0.5,vmin=0,title='',figure_index='clonal_coupling') # actually plot the coupling
[46]:
<AxesSubplot:>

[47]:
new_fate_names=['MkP','HSC','Ery','Neu','Mon','LMPP']
sp_id=[]
for x in new_fate_names:
    sp_id.append(np.nonzero(fate_names==x)[0][0])

ordered_pvalue_greater=pvalue_greater[sp_id][:,sp_id]
ordered_pvalue_greater=np.nan_to_num(ordered_pvalue_greater,nan=1)
[48]:
import numpy as np
import matplotlib.pyplot as plt

# Sample data for the heatmap
data = np.random.rand(5, 5)

# Create a heatmap
ax=cs.pl.heatmap((ordered_pvalue_greater<0.05).astype(float),
              order_map_x=False,order_map_y=False,fig_width=6,color_bar=False,
              x_ticks=new_fate_names,y_ticks=new_fate_names)

# Add text annotations to the heatmap cells
for i in range(ordered_pvalue_greater.shape[0]):
    for j in range(ordered_pvalue_greater.shape[1]):
        plt.text(j, i, f'{ordered_pvalue_greater[i, j]:.2f}', ha='center', va='center', color='white')

ax.set_title('Siginificant coupling (Pvalue shown)')
plt.show()

[49]:
cs.tl.fate_hierarchy(
    adata_orig, selected_fates=selected_fates, source="X_clone"
)  # compute the fate hierarchy
cs.pl.fate_hierarchy(adata_orig, source="X_clone")  # actually plot the hierarchy
         /-Mon
      /-|
     |   \-LMPP
   /-|
  |  |      /-MkP
  |  |   /-|
--|   \-|   \-HSC
  |     |
  |      \-Neu
  |
   \-Ery
Progenitors with the same observed clonal fate bias
[50]:
df_clone=cs.tl.clone_statistics(adata_orig,joint_variable='state_info');
[51]:
ref_fates=['MkP','Mon','Neu','Ery','Baso']
cs.settings.set_figure_params(pointsize=20)
df_clone['state_info']=df_clone['state_info'].str.split(',').apply(lambda x: sorted(x)).apply(lambda x:','.join(x))
celltype_colors=dict(zip(adata_orig.obs['cell_type'].cat.categories,adata_orig.uns['cell_type_colors']))
for fate_tmp in ref_fates:
    all_fates_tmp=ref_fates.copy()
    all_fates_tmp.remove(fate_tmp)
    df_clone_sub=df_clone[df_clone['state_info'].apply(lambda x: (fate_tmp in x) & (('HSC' in x)  or ('LMPP' in x)) & (np.sum([__ in x for __ in all_fates_tmp])==0) )]


    MkP_bias=(adata_orig.obsm['X_clone'][:,df_clone_sub['clone_id'].to_numpy()].sum(1).A.flatten()>0).astype(int)
    cell_id_t1=np.ones(len(MkP_bias)).astype(bool)
    sp_idx=np.arange(np.sum(cell_id_t1))

    cs.pl.fate_map_embedding(adata_orig,MkP_bias,cell_id_t1=cell_id_t1,sp_idx=sp_idx,
                            figure_title=f'{fate_tmp} biased cells')


    color_tmp=celltype_colors[fate_tmp]
    adata_tmp=adata_orig.copy()
    adata_tmp.uns['data_des']=['all_bias_clones']
    adata_tmp.obsm['X_clone']=ssp.csr_matrix(np.array([(MkP_bias>0).astype(int)])).T
    ax=cs.pl.clones_on_manifold(adata_tmp,selected_clone_list=[0],
                            color_list=[color_tmp,color_tmp,color_tmp],clone_markersize=20,
                            selected_times='t0')
    ax.set_title(f'{fate_tmp} biased HSPCs')
    plt.savefig(f'{cs.settings.figure_path}/all_mkp_bias_clones_different_clones_{fate_tmp}.pdf')


Identify MkP-fate biased clones
[52]:
adata_orig_t2=adata_orig[adata_orig.obs['time_info']=='t1']
cs.tl.clonal_fate_bias(
    adata_orig_t2, selected_fate="MkP", alternative="two-sided"
)
cs.pl.clonal_fate_bias(adata_orig_t2)
df_pvalue_MkP=adata_orig_t2.uns['clonal_fate_bias']
100%|███████████████████████████████████████| 393/393 [00:00<00:00, 1565.39it/s]
/Users/shouwen/opt/miniconda3/envs/CoSpar_test/lib/python3.8/site-packages/anndata/compat/_overloaded_dict.py:106: ImplicitModificationWarning: Trying to modify attribute `._uns` of view, initializing view as actual.
  self.data[key] = value

[53]:
sns.histplot(df_pvalue_MkP[df_pvalue_MkP['clone_size']==2]['P_value'])
[53]:
<AxesSubplot:xlabel='P_value', ylabel='Count'>

[54]:
df_clone_sub=df_clone[df_clone['state_info'].apply(lambda x: x=='HSC,MkP')]
df_clone_sub=df_clone_sub.merge(df_pvalue_MkP.filter(['clone_id','clonal_fraction_in_target_fate','P_value','clone_size']),on=['clone_id'])
df_clone_sub
[54]:
| clone_id | clone_size_x | state_info | state_info_N | clonal_fraction_in_target_fate | P_value | clone_size_y | |
|---|---|---|---|---|---|---|---|
| 0 | 41 | 2 | HSC,MkP | 2 | 1.0 | 0.097317 | 1.0 |
| 1 | 104 | 2 | HSC,MkP | 2 | 1.0 | 0.097317 | 1.0 |
| 2 | 107 | 2 | HSC,MkP | 2 | 1.0 | 0.097317 | 1.0 |
| 3 | 135 | 2 | HSC,MkP | 2 | 1.0 | 0.097317 | 1.0 |
| 4 | 163 | 6 | HSC,MkP | 2 | 1.0 | 0.097317 | 1.0 |
| 5 | 181 | 4 | HSC,MkP | 2 | 1.0 | 0.009449 | 2.0 |
| 6 | 196 | 2 | HSC,MkP | 2 | 1.0 | 0.097317 | 1.0 |
| 7 | 198 | 3 | HSC,MkP | 2 | 1.0 | 0.097317 | 1.0 |
| 8 | 305 | 3 | HSC,MkP | 2 | 1.0 | 0.097317 | 1.0 |
| 9 | 307 | 2 | HSC,MkP | 2 | 1.0 | 0.097317 | 1.0 |
| 10 | 318 | 3 | HSC,MkP | 2 | 1.0 | 0.009449 | 2.0 |
| 11 | 371 | 2 | HSC,MkP | 2 | 1.0 | 0.097317 | 1.0 |
[55]:
cs.pl.clones_on_manifold(adata_orig,selected_clone_list=df_clone_sub.query('P_value<0.05').clone_id.to_list(),
                        color_list=['#8da0cb','#8da0cb','#8da0cb'],clone_markersize=20)
[55]:
<AxesSubplot:title={'center':'ID: 318'}>


CoSpar predicted fate bias
[56]:
adata = cs.tmap.infer_Tmap_from_multitime_clones(
    adata_orig,
    clonal_time_points=["t0"],
    later_time_point="t1",
    smooth_array=[10,10,5],
    sparsity_threshold=0.1,
    intraclone_threshold=0.2,
    max_iter_N=10,
    epsilon_converge=0.01,
)
/Users/shouwen/opt/miniconda3/envs/CoSpar_test/lib/python3.8/site-packages/anndata/compat/_overloaded_dict.py:106: ImplicitModificationWarning: Trying to modify attribute `._uns` of view, initializing view as actual.
  self.data[key] = value
[57]:
cs.settings.set_figure_params(pointsize=20,fontsize=18)
for selected_fates in [['MkP'],['Ery'],['Neu'],['Mon']]:
    cs.tl.fate_map(
        adata,
        selected_fates=selected_fates,
        source="transition_map",
        map_backward=True,
    )
    cs.pl.fate_map(
        adata,
        selected_fates=selected_fates,
        selected_times='t0',
        source="transition_map",
        plot_target_state=False,
        background=False,
        show_histogram=False,
        auto_color_scale=False,
        vmax=0.6,

    )


Differential gene analysis
[58]:
adata.obs['Fate_bias']=np.nan
sel_idx_1=((adata.obs['fate_map_transition_map_MkP']>0.25) & (adata.obsm['X_emb'][:,0]<4))
adata.obs.loc[sel_idx_1,'Fate_bias']='Early MkP bias'
sel_idx_2=((adata.obs['fate_map_transition_map_MkP']>0.25) & (adata.obsm['X_emb'][:,0]>=4))
adata.obs.loc[sel_idx_2,'Fate_bias']='Late MkP bias'
#sel_idx_3=((adata.obs['fate_map_transition_map_MkP']<=0.25)) & (adata.obs['time_info']=='t0')
sel_idx_3=((adata.obs['fate_map_transition_map_MkP']<=0.25)) & (adata.obs['state_info']=='HSC')
adata.obs.loc[sel_idx_3,'Fate_bias']='No MkP bias'
sel_idx_4=(adata.obs['state_info']=='LMPP')
adata.obs.loc[sel_idx_4,'Fate_bias']='LMPP'
adata_sub=adata[adata.obs['time_info']=='t0']
[59]:
cs.pl.plot_adata_with_prefered_order(adata,'Fate_bias',plot_order=['LMPP','No MkP bias','Early MkP bias','Late MkP bias' ],
                              palette={'LMPP':'#d9d9d9','No MkP bias':'#ff7f0e','Early MkP bias':'#1f77b4','Late MkP bias':'grey'},
                              linewidth = 0,s=100)
#plt.tight_layout()
plt.savefig(f'{figure_path}/X_emb_fate_bias_MkP.pdf')

[60]:
make_gene_heatmap=True
if make_gene_heatmap:
    sc.tl.rank_genes_groups(adata_sub, 'Fate_bias', method='wilcoxon',reference='Early MkP bias')
    sc.pl.rank_genes_groups(adata_sub, n_genes=10, sharey=False)

    adata_sub_1=adata_sub[~pd.isna(adata_sub.obs['Fate_bias'])]
    sc.tl.filter_rank_genes_groups(adata_sub_1)
    sc.pl.rank_genes_groups_heatmap(adata_sub_1, n_genes=200, key='rank_genes_groups_filtered',
                                    swap_axes=True, use_raw=False, vmax=10, vmin=0, cmap='Reds', dendrogram=False,save='gene_heatmap')
/Users/shouwen/opt/miniconda3/envs/CoSpar_test/lib/python3.8/site-packages/anndata/_core/anndata.py:1235: ImplicitModificationWarning: Trying to modify attribute `.obs` of view, initializing view as actual.
  df[key] = c
/Users/shouwen/opt/miniconda3/envs/CoSpar_test/lib/python3.8/site-packages/anndata/_core/anndata.py:1235: ImplicitModificationWarning: Trying to modify attribute `.obs` of view, initializing view as actual.
  df[key] = c
/Users/shouwen/opt/miniconda3/envs/CoSpar_test/lib/python3.8/site-packages/anndata/_core/anndata.py:1235: ImplicitModificationWarning: Trying to modify attribute `.obs` of view, initializing view as actual.
  df[key] = c

WARNING: Gene labels are not shown when more than 50 genes are visualized. To show gene labels set `show_gene_labels=True`
WARNING: saving figure to file figures/heatmapgene_heatmap.pdf
/Users/shouwen/opt/miniconda3/envs/CoSpar_test/lib/python3.8/site-packages/scanpy/tools/_rank_genes_groups.py:796: RuntimeWarning: overflow encountered in expm1
  (expm1_func(mean_in_cluster) + 1e-9)
/Users/shouwen/opt/miniconda3/envs/CoSpar_test/lib/python3.8/site-packages/scanpy/tools/_rank_genes_groups.py:797: RuntimeWarning: overflow encountered in expm1
  / (expm1_func(mean_out_cluster) + 1e-9)
/Users/shouwen/opt/miniconda3/envs/CoSpar_test/lib/python3.8/site-packages/scanpy/tools/_rank_genes_groups.py:796: RuntimeWarning: invalid value encountered in divide
  (expm1_func(mean_in_cluster) + 1e-9)
/Users/shouwen/opt/miniconda3/envs/CoSpar_test/lib/python3.8/site-packages/anndata/compat/_overloaded_dict.py:106: ImplicitModificationWarning: Trying to modify attribute `._uns` of view, initializing view as actual.
  self.data[key] = value

[61]:
cluster_name='No MkP bias'
df_DGE=pd.DataFrame({'logfoldchanges':pd.DataFrame(adata_sub_1.uns['rank_genes_groups']['logfoldchanges'])[cluster_name],
'logpvalue': -np.log10(pd.DataFrame(adata_sub_1.uns['rank_genes_groups']['pvals_adj'])[cluster_name]),
'gene': pd.DataFrame(adata_sub_1.uns['rank_genes_groups']['names'])[cluster_name]})


cluster_name='Late MkP bias'
df_DGE_1=pd.DataFrame({'logfoldchanges':pd.DataFrame(adata_sub_1.uns['rank_genes_groups']['logfoldchanges'])[cluster_name],
'logpvalue': -np.log10(pd.DataFrame(adata_sub_1.uns['rank_genes_groups']['pvals_adj'])[cluster_name]),
'gene': pd.DataFrame(adata_sub_1.uns['rank_genes_groups']['names'])[cluster_name]})

df_DGE_all=pd.concat([df_DGE,df_DGE_1],ignore_index=True)
[62]:
cs.settings.set_figure_params(pointsize=10)
fig,ax=plt.subplots(figsize=(4,3.5))
plt.scatter(df_DGE['logfoldchanges'],
            df_DGE['logpvalue'],
            s=2,color='k')
plt.xlim([-17,17])

DGE_genes_1=['Hlf','Mecom','Mpl','Mllt3','Tbxas1','Ifitm1',
                                 'Pbx1','Meis1',]
DGE_genes_2=['H2afy','Ptma','Cdk6','Mpo','Flt3','Hmgb2','Top2a']

# DGE_genes_1=df_DGE[(df_DGE['logfoldchanges']<0) & (df_DGE['logpvalue']>3)].assign(filter=lambda x: x['gene'].isin(highlighted)).query('filter==True')['gene'].to_list()
# DGE_genes_2=df_DGE[(df_DGE['logfoldchanges']>0) & (df_DGE['logpvalue']>3)].assign(filter=lambda x: x['gene'].isin(highlighted)).query('filter==True')['gene'].to_list()

for g in DGE_genes_1:
    color='#1f77b4'
    df_DGE_sel=df_DGE[df_DGE['gene'].isin(DGE_genes_1)]
    plt.scatter(df_DGE_sel['logfoldchanges'],
                df_DGE_sel['logpvalue'],
                s=5,color=color)

    tmp=df_DGE[df_DGE['gene']==g].values[0]
    ax.text(tmp[0]+0.5, tmp[1]+0, tmp[2],fontsize=11,color=color,style='italic')

for g in DGE_genes_2:
    color='#ff7f0e'
    df_DGE_sel=df_DGE[df_DGE['gene'].isin(DGE_genes_2)]
    plt.scatter(df_DGE_sel['logfoldchanges'],
                df_DGE_sel['logpvalue'],
                s=5,color=color)

    tmp=df_DGE[df_DGE['gene']==g].values[0]
    ax.text(tmp[0]+0.5, tmp[1]+0, tmp[2],fontsize=11,color=color,style='italic')

plt.xlabel('Log fold changes')
plt.ylabel('-log10 (corrected Pvalue)')
plt.tight_layout()
plt.savefig(f'{figure_path}/DGE_analysis_MkP.pdf')
[63]:
adata.obs['cell_type_2']=adata.obs['cell_type'].astype(str)
adata.obs.loc[adata.obs_names.isin(adata_sub.obs_names),'cell_type_2']=adata_sub.obs['Fate_bias']
cs.pl.embedding(adata,color='cell_type_2')

[64]:
cs.settings.set_figure_params(fontsize=11)
cs.settings.verbosity=3
adata.obs['state_info']=adata.obs['cell_type_2']
# sel_genes=list(set(list(highlighted)+df_DGE_all[(df_DGE_all['logpvalue']>12)]['gene'].to_list()))
# sel_genes=[x for x in sel_genes if 'Rp' not in x]

sel_genes=[ 'Spi1','Cd27','Sox4','Rnf220','Pecam1','Cd34','H2afy','Plac8','Sell','Flt3','Satb1','Aff3', 'Hlf','Klf12','Ifitm1',
 'Mllt3','Mecom','Samd12','Plxdc2','Ghr','Sox5','Rora',
 'Dlg2', 'Tbxas1', 'Mpl', 'Nrxn1', 'Stat4', 'Crebrf',
       'Nfat5', 'Mctp1', 'Ccnd3', 'Erg', 'Ptprc', 'Sgms1', 'Clec2d',
       'Nfia', 'Zbtb20', 'Malat1', 'Tcf4', 'Atf7', 'Irf2', 'Meis1',
       'Foxp1', 'Foxn3', 'Tcf12', 'Bcl11a', 'Ifitm3',  'Prkg1',
       'Tcf15','Pbx3', 'Runx1',
'Pbx1','Vwf','Gata2','Fli1','Apoe','Top2a','Hmgb2','Runx3','H2afz','Slc25a5','Ran','Tfdp1','Ezh2',
 'Cdk6','Atpif1','Ybx1','Eif5a','Anp32b','Pfn1','Hspd1','Stmn1',
 'Phb2','Mif','Atp5b','Actg1','Ptma','Hsp90aa1','Ppia','C1qbp','Hmgb1','Elf1','Gata1']


matrix=cs.pl.gene_expression_heatmap(adata,selected_genes=sel_genes,
                              selected_fates=['No MkP bias', 'Early MkP bias','Late MkP bias','MkP'],
                             fig_width=18,fig_height=3,order_map_y=False,order_map_x=False,print_ordered_labels=False,method='zscore')
adata.obs['state_info']=adata.obs['cell_type']
plt.tight_layout()
plt.savefig(f'{figure_path}/DGE_analysis_MkP_heatmap.pdf')
--> Using zscore (range: [-2,2], or [-1,1]
[65]:
DGE_genes=['Hlf','Mecom','Mpl','Mllt3','Tbxas1','Ifitm1']
#DGE_genes=['Pbx1','Apoe']

cs.settings.set_figure_params(figsize=(2.5,2.5),pointsize=30,fontsize=17)
cs.pl.gene_expression_on_manifold(adata_sub,DGE_genes,savefig=True)


Fate bias and pseudotime
[66]:
cs.settings.set_figure_params(figsize=(3,3),pointsize=10)
selected_fates=["MkP", ["Ery",'Neu','Mon','LMPP']]
cs.tl.fate_bias(
    adata,
    selected_fates=selected_fates,
    source="transition_map",
    pseudo_count=0,
)
cs.pl.fate_bias(
    adata,
    selected_fates=selected_fates,
    source="transition_map",
    plot_target_state=False,
    vmax=0.8,
    vmin=0.15,
)
Results saved at adata.obs['fate_map_transition_map_MkP']
Results saved at adata.obs['fate_map_transition_map_Ery_Neu_Mon_LMPP']
Results saved at adata.obs['fate_bias_transition_map_MkP*Ery_Neu_Mon_LMPP']

[67]:
cs.tl.progenitor(
    adata,
    selected_fates=selected_fates,
    source="transition_map",
    map_backward=True,
    bias_threshold_A=0.6,
    bias_threshold_B=0.4,
    sum_fate_prob_thresh=0.2,
    avoid_target_states=True,
)
cs.pl.progenitor(
    adata, selected_fates=selected_fates, source="transition_map"
)
Results saved at adata.obs['fate_map_transition_map_MkP']
Results saved at adata.obs['fate_map_transition_map_Ery_Neu_Mon_LMPP']
Results saved at adata.obs['fate_bias_transition_map_MkP*Ery_Neu_Mon_LMPP']
Results saved at adata.obs[f'progenitor_transition_map_MkP'] and adata.obs[f'diff_trajectory_transition_map_MkP']
Results saved at adata.obs[f'progenitor_transition_map_Ery_Neu_Mon_LMPP'] and adata.obs[f'diff_trajectory_transition_map_Ery_Neu_Mon_LMPP']


[70]:
cs.settings.set_figure_params(figsize=(4,4),pointsize=10,fontsize=15)
gene_name_list = ['Mecom', "Vwf",'Mpl','Tbxas1','Ifitm1',
                                 'Meis1']
selected_fate = "MkP"
cs.pl.gene_expression_dynamics(
    adata,
    selected_fate,
    gene_name_list,
    traj_threshold=0.2,
    invert_PseudoTime=False,
    compute_new=True,
    gene_exp_percentile=99,
    n_neighbors=8,
    plot_raw_data=False,
    ggplot_font_size=17,
)